|
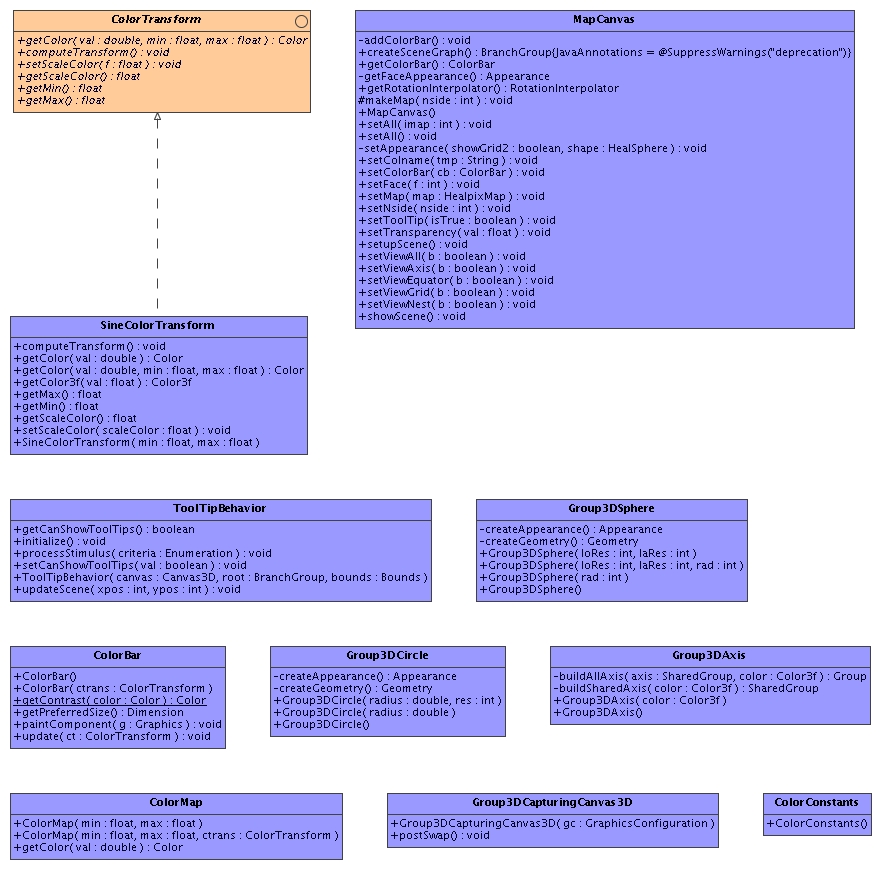
Package healpix.plot3d.canvas3d
This package contains the canvas classes related to construct a 3d scene with a data color bar, axis and equator.
See:
Description
|
Interface Summary |
| ColorTransform |
Interface that deals with color transformations |
|
Class Summary |
| ColorBar |
Displaying a bar of colors (the scale) using a ColorTransform and the min and
max values. |
| ColorConstants |
Some color factor to get them from a static way. |
| ColorMap |
Creates a color map using a color transformation of data values. |
| Group3DAxis |
Group3DAxis draws three 3D axes x,y,z, composed of cylinders, with cones as
their 'arrow'. |
| Group3DCapturingCanvas3D |
Class CapturingCanvas3D, using the instructions from the Java3D FAQ pages on
how to capture a still image in jpeg format. |
| Group3DCircle |
A circle shape, extending Shape3D, drawn in the x,y plane around the origin
Radius and number of points that make up the circle may be set |
| Group3DSphere |
A sphere shape, extending Shape3D, but drawn using longitude/latitude lines. |
| MapCanvas |
Create Canvas 3D with tooltip behaviour and Color bar min/max displayed. |
| SineColorTransform |
A Sine color transform. |
| ToolTipBehavior |
A behavior similar to SelectionBehavior, except you don't have to
double-click and the resulting info is presented in a tool-tip, not the
console.Using swings default (ToolTipManager) initialDelay constant. |
Package healpix.plot3d.canvas3d Description
This package contains the canvas classes related to construct a 3d scene with a data color bar, axis and equator.
A tooltip behaviour gives the value and angular info of the sphere pixel each time the mouse roll-over.
Is also included a transparency utility and a rotational feature.
The viewer gets the data whether from a fits file or a created healpix map using the data model included in healpix.core.dm package.
This distribution contains few samples under data/test to play with.
The viewers are under healpix.plot3d.progs.
|
|